


Nationwide, 118 million square feet of office space was underway as of April, with nearly 110 million being Class A or A+ product, according to the latest Yardi Matrix report.
Report Highlights:
- The average full-service equivalent listing rate was $38.23 per square foot at the end of April, a 1.0 percent increase from the same time in 2022.
- As of April, office vacancy stood at 16.7 percent across the top 50 U.S. office markets, up 100 basis points from April 2022.
- The under-construction pipeline totaled 118.2 million square feet of office space at the end of April.
- Nationwide office transaction volume totaled $9.4 billion in the first four months of the year.
Class A properties in high demand
Office transaction volume totaled $9.4 billion at the end of April, and the average price per square foot stood at $196. Sales activity was concentrated on East Coast markets such as Manhattan ($858 million), New Jersey ($807 million) and Boston ($721 million). Los Angeles ($629 million) and Washington, D.C. ($509 million) followed closely, as large office deals had a greater influence on market sales volume in 2023.
Nationwide, the active pipeline featured some 118.2 million square feet of office space under construction at the end of April, representing 1.8 percent of total stock. Almost 110 million square feet encompassed Class A and A+ office properties, or 3.6 percent of total stock. Another 300 million square feet was in planning stages, pushing the rate to 5.6 percent of total stock.
The largest pipeline on a percentage of stock basis was found in Austin (5.9 million square feet underway, 6.7 percent of stock), Nashville (3.6 million, 6.4 percent), Boston (14.7 million, 6.1 percent), San Diego (4.9 million, 5.3 percent), San Francisco (7.9 million, 5.1 percent) and Seattle (6.8 million, 5.0 percent).
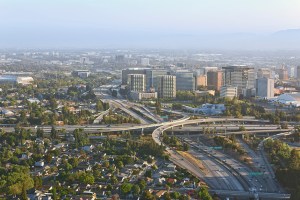
Tech-centric markets face pressure
Office vacancy nationwide reached 16.7 percent in April, up 10 basis points when compared to the previous month and 100 basis points more than in April 2022. The highest rates were recorded in tech-powered markets such as San Francisco (19.4 percent), Seattle (19.0 percent), Portland (16.5 percent) and San Diego (14.7 percent).
National average full-service equivalent listing rates clocked in at $38.23 per square foot at the end of April, decreasing by 230 basis points from April 2022, the Yardi Matrix report shows. The pandemic weakened demand for office space, prompting companies to sublease or vacate their offices.
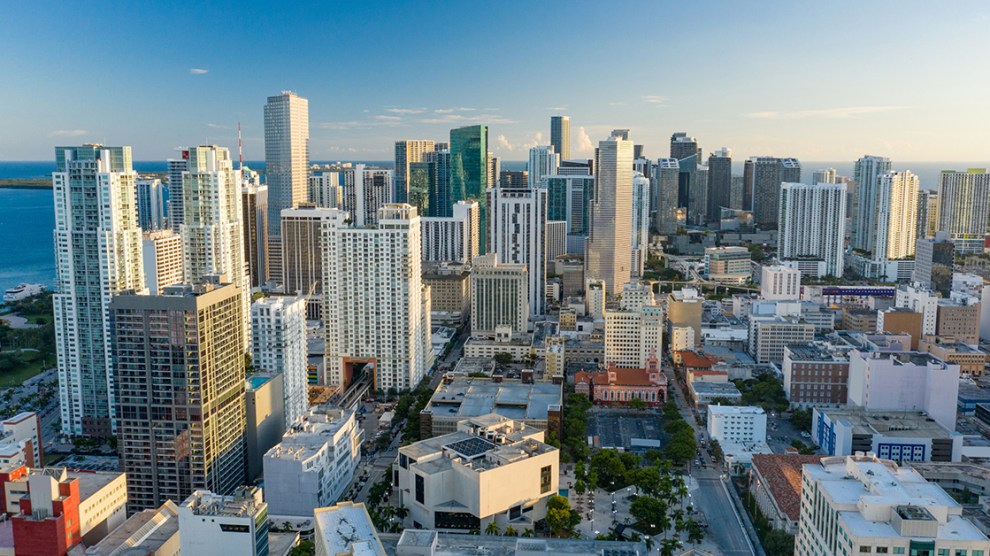
The largest gains in asking rates year-over-year were present in San Diego (17.9 percent), Philadelphia (8.9 percent), Boston (8.8 percent), Seattle (8.1 percent) and Orlando (7.8 percent). On the other side of the spectrum, Brooklyn (-7.7 percent), the Bay Area (-3.3 percent), Miami (-2.6 percent), Austin (-2.6 percent) and Houston (-1.2 percent) recorded the biggest declines.
Read the full Matrix Office National Report-May 2023


Add Comment